Webinar
Webinar: Traffic Visualization and Real-time Analysis [in Swedish]
Published 2021-04-13
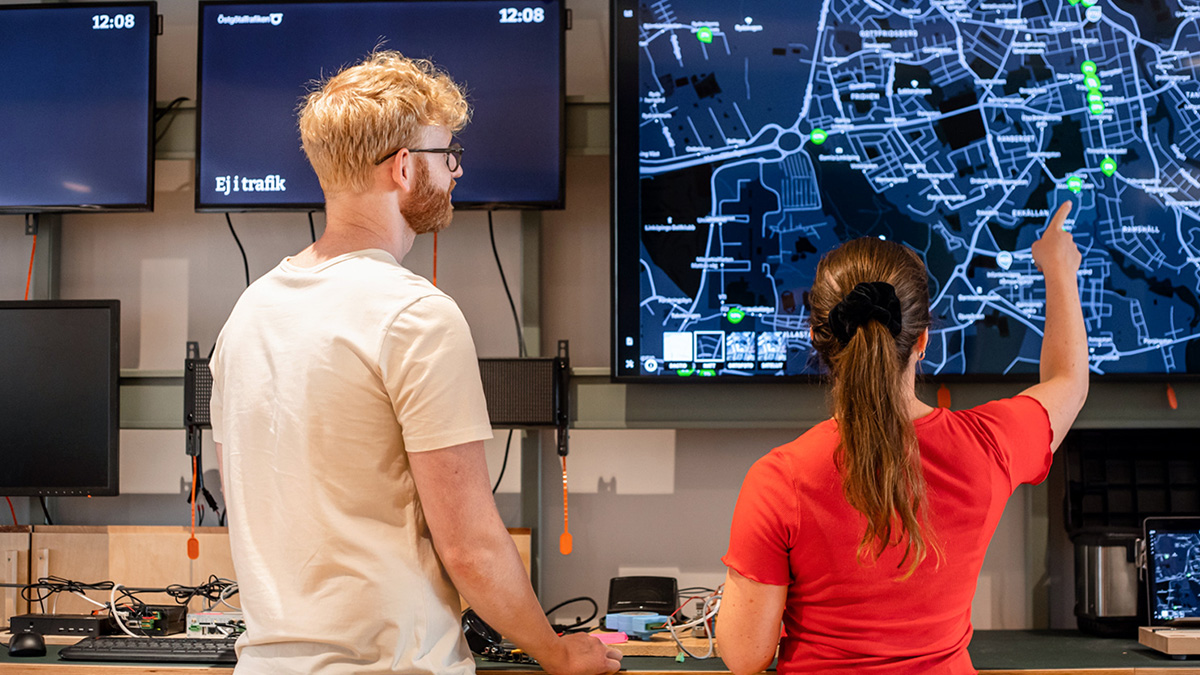
Combining visualization with data analysis in real-time makes it easier to oversee ongoing traffic and system status and act on deviations in a constantly changing present situation. Watch the webinar where Björn & Hans explain further.
On the 30th of March, we live-streamed a webinar about traffic visualization and real-time analysis, with Hans Ekström and Björn Götestrand in front of the camera. Using examples from Gaia Public Transport, they demonstrated the power of using easy-to-understand visualization to gain rapid insights based on large, fast-moving data sets and advanced analysis functions. The entire webinar was recorded and can be viewed above. You can find more of our webinars on our YouTube channel.
Learn more about Gaia Public Transport Analysis functions here.


